
 Agriculture
  Manufacturing
 Automobile
 Pharmaceutical
 RealEstate
 Education
 Events
 Industry 4.0
 Lab Setup
 Training
 Product Demonstrator
 Remote Assistance (MR)
 Virtual Showroom
 Virtual Try on
 Print Media
  Virtual Reality

Introduction
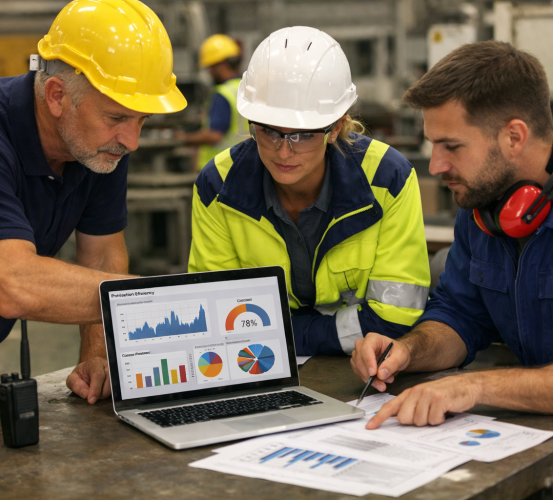
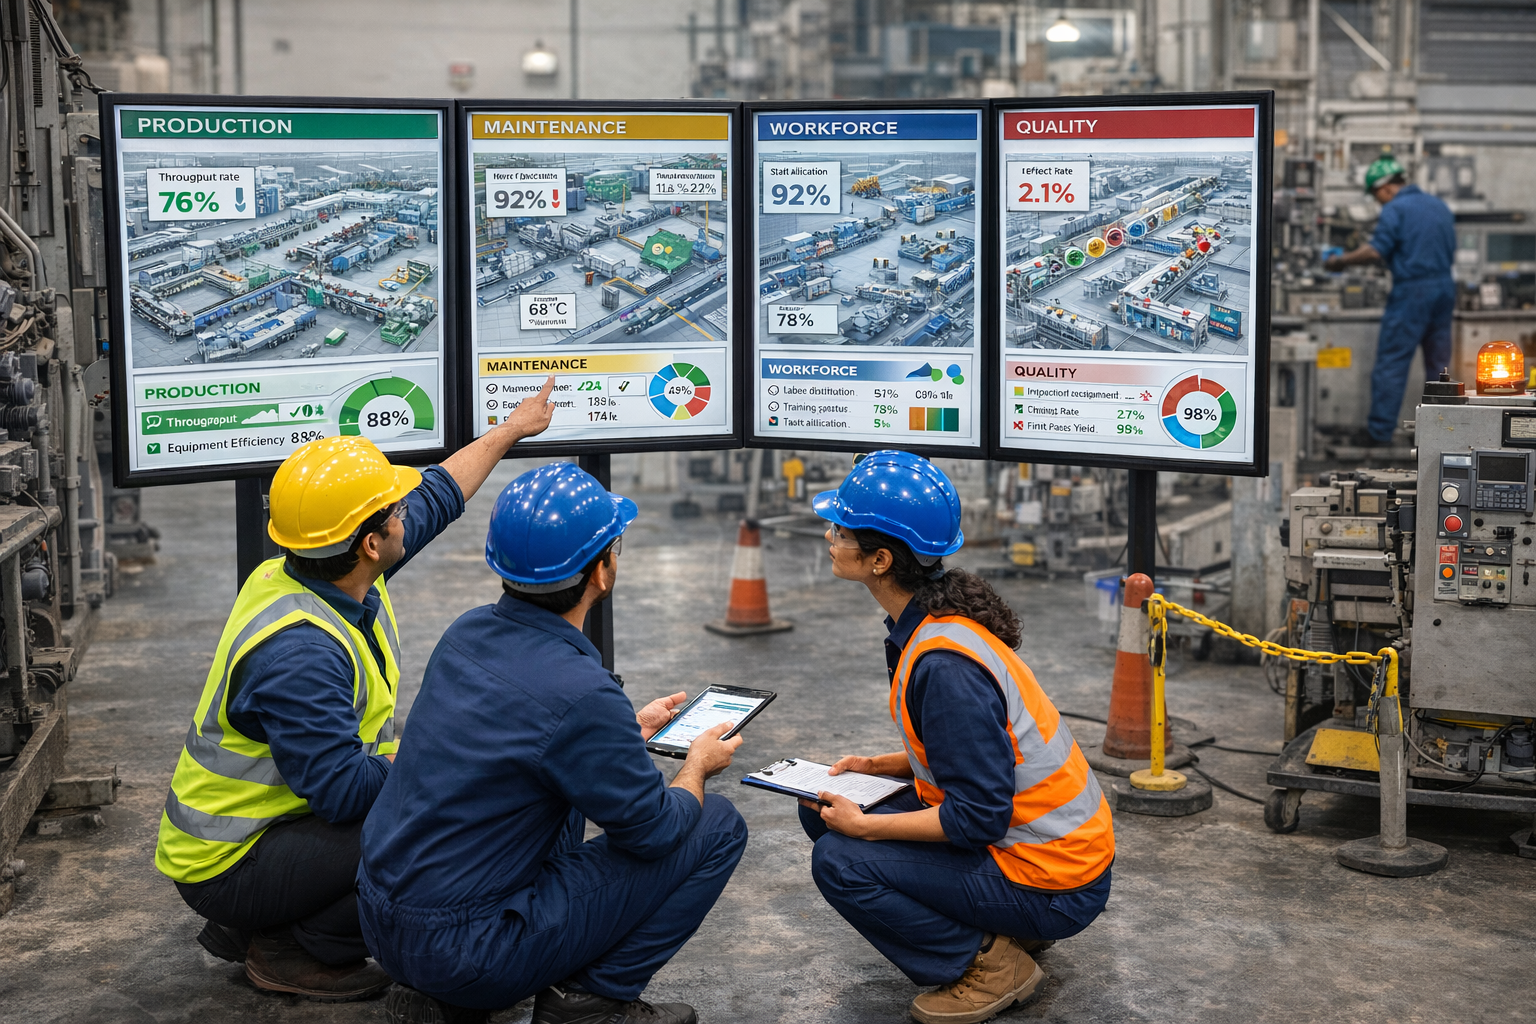
Manufacturing environments operate through a combination of production lines, machinery, quality checkpoints, and workforce-driven processes. As facilities scale and operations become more interconnected, organizations rely on operational Key Performance Indicators (KPIs) to maintain visibility across production flow, asset readiness, workforce coverage, and quality alignment.
KPIs provide structured numerical insights, but manufacturing operations are influenced by physical layouts, machine dependencies, shift patterns, and human activity. Because of this, KPI values alone do not always reflect the full operational picture. Meaningful interpretation depends on understanding how these indicators connect to real shop-floor conditions.
Interpreting KPIs Beyond Dashboards

Manufacturing KPIs are commonly reviewed through dashboards, reports, and scheduled performance meetings. These tools are effective for monitoring trends, but they can separate data from daily operational realities.
Changes in production sequencing, equipment availability, maintenance schedules, or workforce deployment can all influence KPI movement. When these factors are not visible during reviews, teams may focus on numbers without fully understanding what operational conditions contributed to those trends.
This creates a gap between KPI visibility and operational understanding.
Bringing Operational Context into KPI Discussions
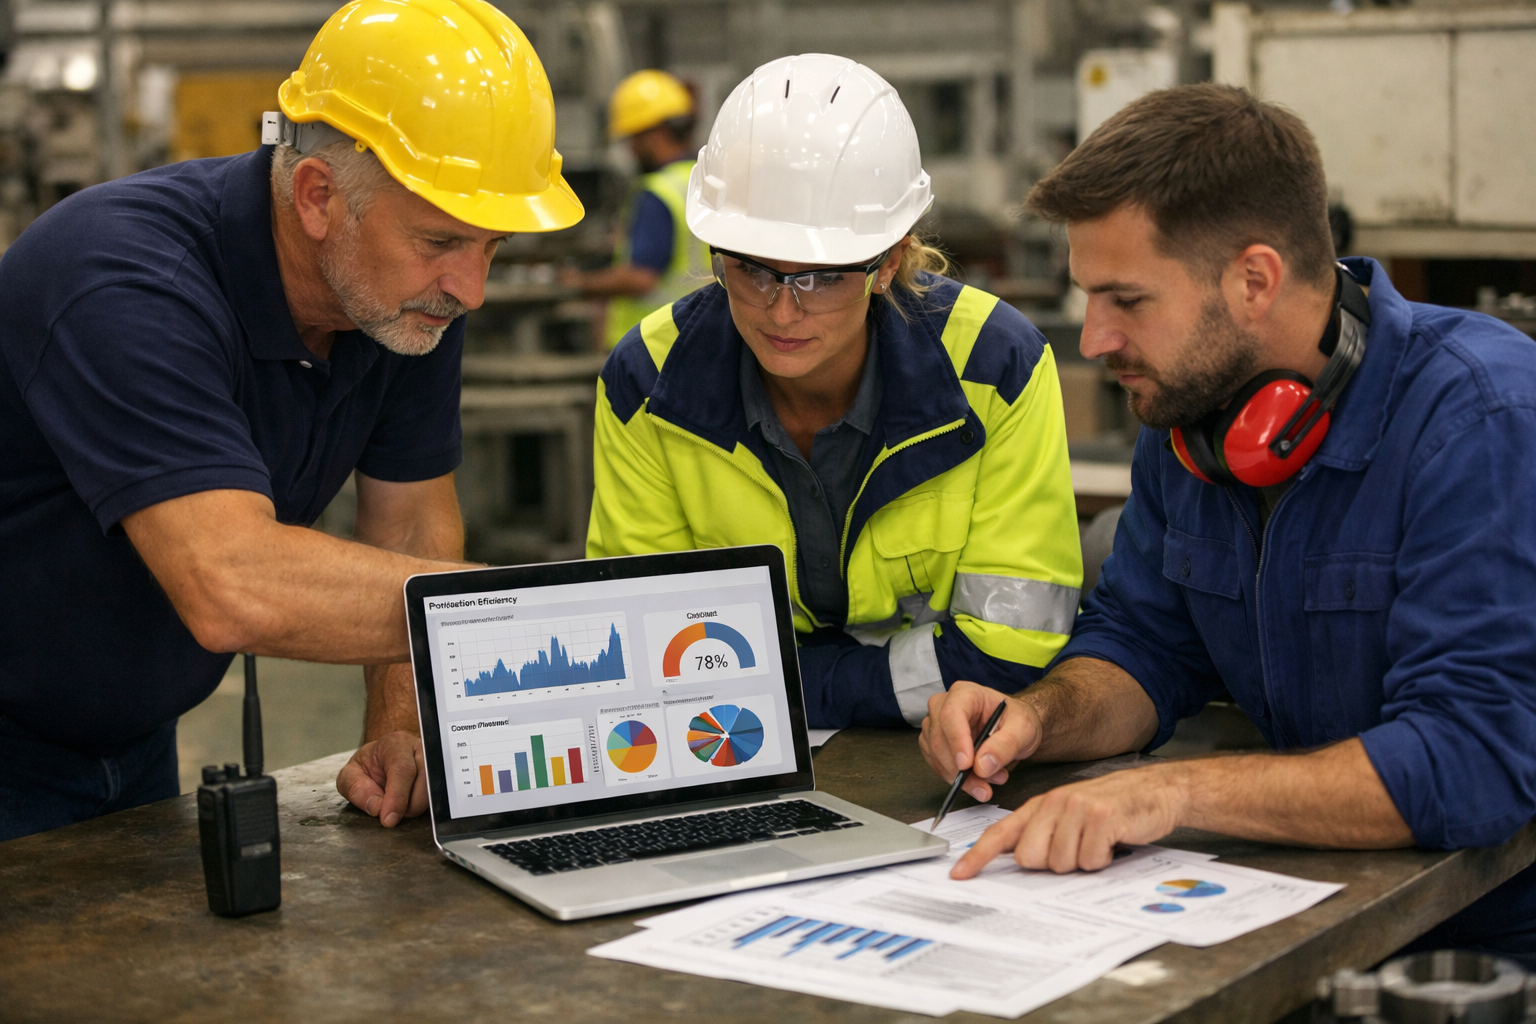
To close this gap, manufacturing teams increasingly explore ways to discuss KPIs alongside operational context. Contextual visualization allows teams to reference production lines, equipment layouts, and workflows while reviewing KPI trends.
For example, when a production indicator is discussed, teams can look at visual representations of line balance or machine interactions. Maintenance indicators become clearer when asset locations and service zones are visible. Workforce-related indicators gain meaning when training environments and task areas are mapped visually.
These approaches do not change KPI definitions or reporting structures. They support clearer interpretation by linking data to physical and procedural realities.
How Context Shapes Day-to-Day Manufacturing Decisions
When KPIs are reviewed with operational context, discussions tend to become more focused and aligned. Teams move beyond asking whether a KPI has changed and begin exploring how shop-floor conditions or workflows may be influencing the numbers.
This shared understanding supports better communication between production, maintenance, quality, and plant leadership teams. KPI discussions become more collaborative and grounded in operational reality, without altering targets, benchmarks, or governance models.
Domain-Specific KPI Understanding in Manufacturing
Operational KPIs in manufacturing span multiple functional areas, each requiring a different lens of interpretation.
Production-related indicators are easier to understand when teams can visualize line layouts, throughput stages, and process sequencing. Maintenance indicators benefit from visual clarity around asset configurations, inspection zones, and service paths. Workforce indicators gain relevance when training environments, task allocation, and role coverage are viewed alongside operational areas. Quality indicators become more meaningful when inspection points and checkpoints are seen in relation to production flow.
Each KPI category relies on understanding where and how work is carried out on the shop floor.
Visualization Specialization for Manufacturing Environments
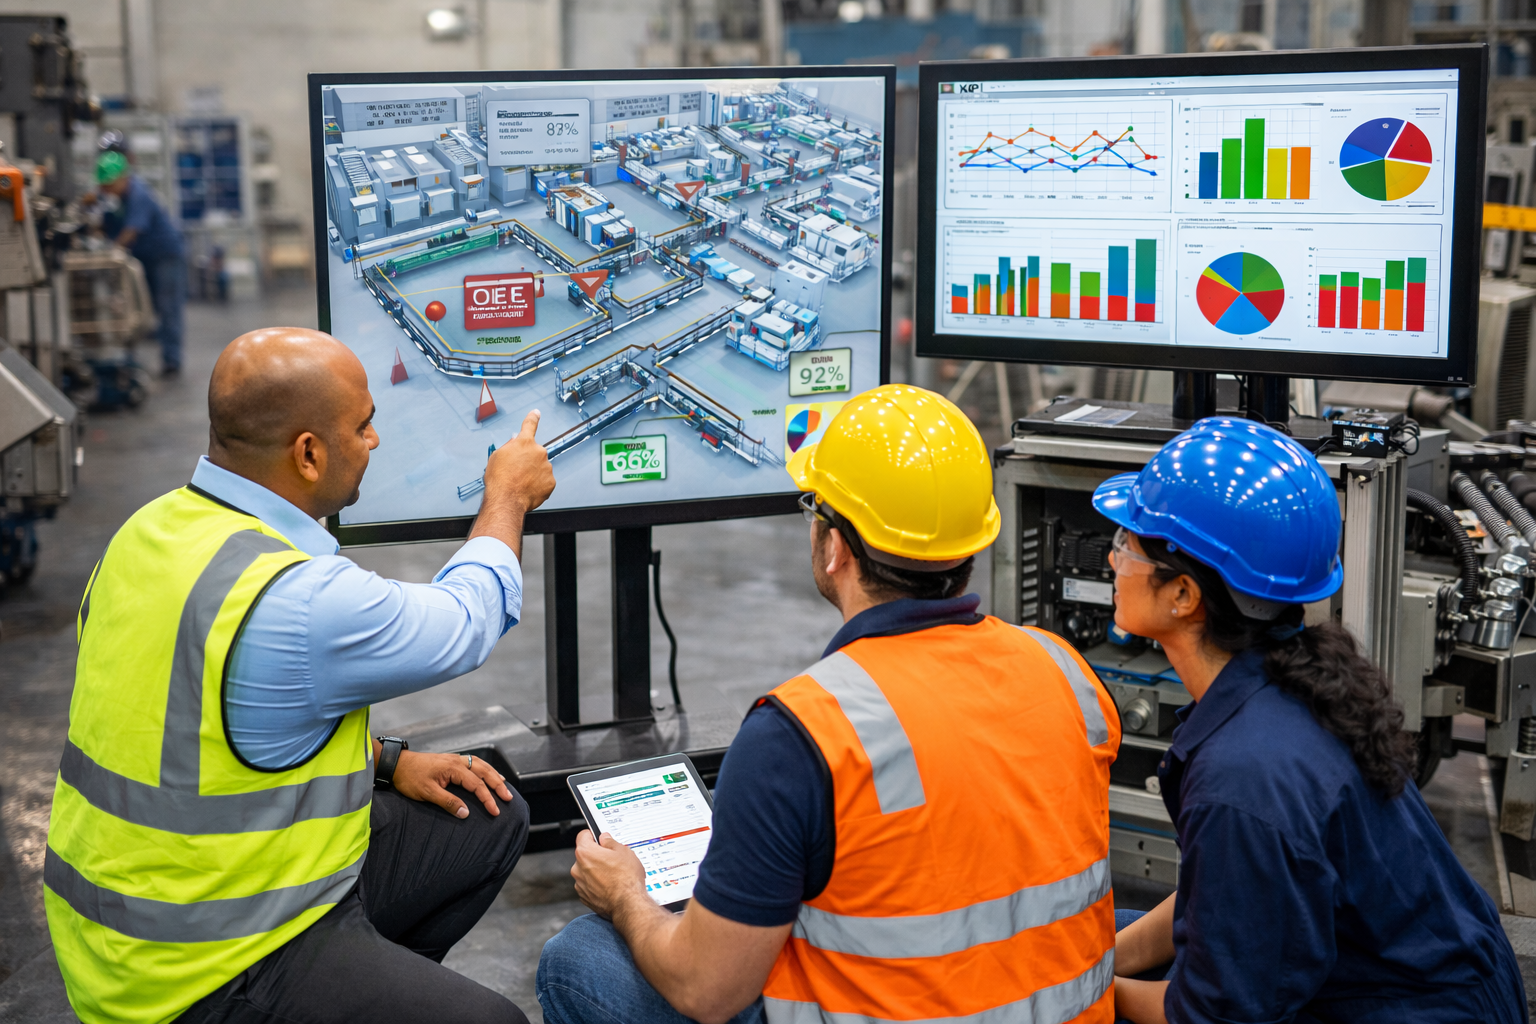
Within these manufacturing-specific needs, Yeppar smart solutions offers visualization-focused solutions designed for industrial environments. These solutions digitally represent shop floors, equipment, and workflows in immersive formats that support KPI interpretation and cross-functional discussions.
Rather than introducing new KPIs or modifying performance frameworks, this approach focuses on adding visual context to existing indicators. By representing real manufacturing conditions digitally, teams can better relate KPI data to physical processes without disrupting established systems or procedures.
Why Contextual KPI Understanding Matters
Operational KPIs play a central role in manufacturing oversight, but their value depends on how clearly teams understand the conditions behind the data. Without context, KPIs risk becoming isolated metrics rather than meaningful operational signals.
Contextual, domain-aware visualization helps bridge this gap by linking numerical indicators with real-world environments. This strengthens alignment across teams, improves clarity during reviews, and supports more informed operational discussions—while keeping existing KPI structures unchanged.
Conclusion
Operational KPIs remain essential to manufacturing decision-making. However, meaningful interpretation requires more than numerical visibility. It requires an understanding of how production lines, assets, people, and processes interact on the shop floor.
By supporting KPI discussions with operational context and domain-specific visualization, manufacturing organizations can enhance clarity and collaboration across teams. This approach improves how KPIs are understood and discussed, without changing existing indicators, procedures, or governance frameworks.
FAQs-
What are operational KPIs in manufacturing?
They are indicators used to track production flow, asset readiness, workforce coverage, and quality alignment.
Why do manufacturing KPIs need operational context?
Because numerical data alone does not reflect shop-floor conditions, equipment interactions, or process dependencies.
How does visualization support KPI interpretation in manufacturing?
It allows teams to review KPI trends alongside visual representations of production lines, assets, and workflows.
Do visualization approaches replace KPI systems?
No. They support understanding and discussion around existing KPI frameworks.

 Contact Us