
 Agriculture
  Manufacturing
 Automobile
 Pharmaceutical
 RealEstate
 Education
 Events
 Industry 4.0
 Lab Setup
 Training
 Product Demonstrator
 Remote Assistance (MR)
 Virtual Showroom
 Virtual Try on
 Print Media
  Virtual Reality

Introduction
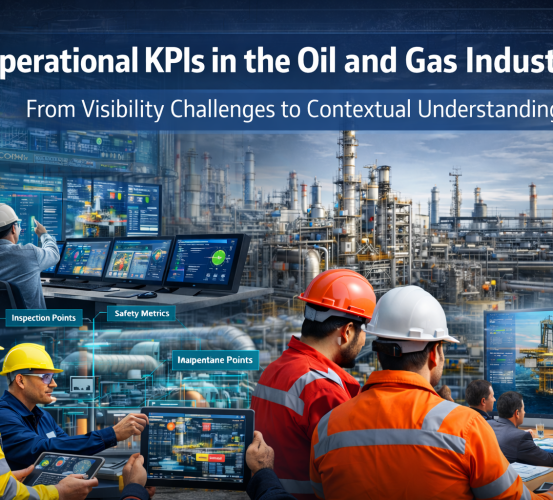
The oil and gas industry operates across large, distributed, and asset-intensive environments. From upstream exploration sites to downstream refineries and pipelines, operational activities involve multiple teams, systems, and procedures working in parallel.
To maintain alignment and oversight, organizations rely on Key Performance Indicators (KPIs). These KPIs help track operational status, safety adherence, asset readiness, and workforce preparedness. However, while KPI data is widely available, interpreting what the numbers mean in real operational contexts remains a common challenge.

Limited Context Behind Operational KPIs
In many oil and gas operations, KPIs are monitored through dashboards, reports, and periodic reviews. While these systems provide numerical visibility, they often lack contextual depth.
Common challenges include:
-
KPIs distributed across disconnected systems
-
Limited linkage between field activities and KPI trends
-
Difficulty understanding site-specific variations
-
Inconsistent interpretation of KPIs across teams and locations
-
Delays in identifying contributing operational factors
As a result, KPIs may be reviewed regularly but discussed at a surface level, without full clarity on underlying operational conditions.
Visualization-Led KPI Interpretation
Rather than redefining KPIs, organizations increasingly explore visualization-based approaches to better understand existing indicators.
Visualization tools help teams:
-
Represent physical assets, facilities, and workflows visually
-
Connect KPI discussions with real operational environments
-
Create shared context during reviews and planning sessions
-
Support cross-functional communication using visual references
For example, when a maintenance or safety KPI shows variation, visual representations of equipment layouts or site workflows can help teams discuss possible contributing factors more clearly.
These approaches focus on interpretation and understanding, not automation or KPI replacement.
More Informed KPI Discussions Across Teams
When KPIs are supported by visual context, discussions tend to become more structured and aligned.
Commonly observed impact areas include:
-
Clearer understanding during KPI review meetings
-
Better alignment between field teams and central operations
-
Improved collaboration across engineering, safety, and operations
-
Reduced ambiguity around KPI relevance and scope
Importantly, these impacts relate to how KPIs are discussed and understood, not to changes in targets, benchmarks, or performance outcomes.
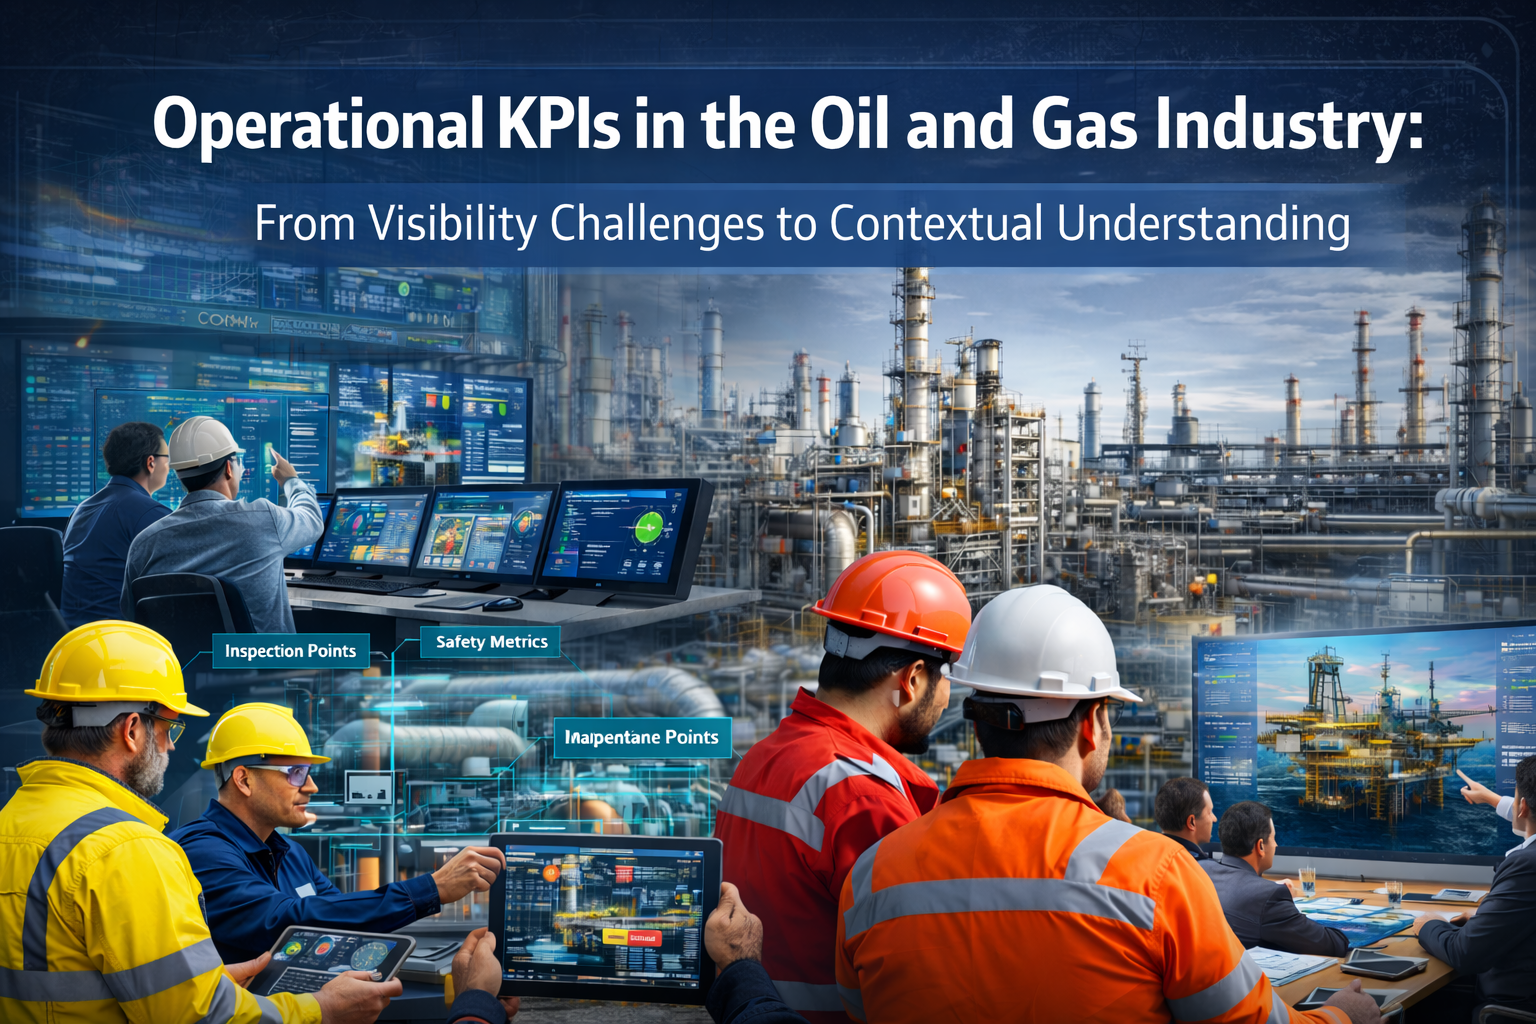
KPI Context by Operational Area
Different operational domains within oil and gas prioritize different KPI categories. Visualization approaches are often specialized to support these domain-specific needs.
Safety and Compliance KPIs
Safety-related KPIs depend on procedural awareness and site-specific conditions. Visual representations of work environments help teams discuss safety observations, task sequences, and procedural alignment in a structured manner.
This specialization supports preparedness and understanding, not enforcement or auditing.
Asset and Maintenance KPIs
Maintenance KPIs are closely linked to asset condition, inspection planning, and task coordination. Visual models of equipment and facilities allow teams to contextualize maintenance indicators during planning and review discussions.
The focus remains on clarity and shared understanding, without altering maintenance workflows.
Workforce Readiness KPIs
Workforce KPIs often track training exposure, role familiarity, and operational awareness. Visualization environments aligned with oil and gas settings help teams understand how training activities map to operational areas.
This supports workforce discussions without replacing existing training frameworks.
Operational Consistency KPIs
Operational consistency KPIs vary across sites, shifts, and asset types. Visualization tools allow teams to compare workflows and layouts across locations, supporting discussions around variation and alignment.
This helps teams interpret KPIs consistently across geographically distributed operations.
Yeppar’s Specialization in KPI Visualization
Within these domain-specific needs, Yeppar provides visualization-focused solutions designed for oil and gas environments. These solutions represent facilities, workflows, and assets in immersive digital formats that support KPI interpretation and cross-team communication.
Rather than introducing new KPIs or measurement systems, Yeppar’s approach focuses on adding visual context to existing KPI frameworks, helping teams better understand operational indicators in relation to real-world environments.
Conclusion
Operational KPIs play a critical role in how oil and gas organizations monitor and discuss their activities. However, KPIs become truly meaningful only when teams understand the context behind the numbers.
Visualization-based approaches offer a structured way to support KPI interpretation by linking data with physical environments, workflows, and operational scenarios. By enhancing contextual understanding—without changing existing KPIs or procedures—these approaches help teams engage in clearer, more informed operational discussions.
FAQs
What are operational KPIs in the oil and gas industry?
They are indicators used to track safety, asset readiness, workforce preparedness, and operational consistency.
Why is KPI interpretation challenging in oil and gas operations?
Due to complex assets, distributed sites, and limited contextual visibility behind numerical data.
Do visualization approaches replace KPI systems?
No. They support interpretation and discussion around existing KPIs.
Which KPI areas benefit most from visualization?
Safety, maintenance, workforce readiness, and operational consistency KPIs.

 Contact Us